ELK vs OpenSearch vs Datadog: Which Log Platform Fits Your Team?
The right answer depends on three variables: your daily log volume, your compliance requirements, and whether anyone on your team can own a cluster. Datadog wins on speed to value—you ship logs and see dashboards the same afternoon—but per-GB pricing compounds fast, and at 150 GB a day a logging bill can cross six figures a year. Cost at scale is the single most common reason companies come to us to migrate off SaaS logging. OpenSearch, the Apache 2.0 fork stewarded by AWS, makes sense if you are all-in on AWS and want a managed service with zero license questions. The Elastic Stack still has the deepest feature set—runtime fields, ES|QL, mature prebuilt security detections—and since Elasticsearch returned to open source under AGPLv3 in 2024, licensing is no longer the objection it once was.
| Factor | Elastic Stack (ELK) | OpenSearch | Datadog Logs |
|---|
| License | Free and open (AGPLv3) with paid tiers | Apache 2.0 | Proprietary SaaS |
| Runs on | Your VMs, Kubernetes, or Elastic Cloud | Anywhere; managed on AWS | Datadog’s cloud only |
| Cost driver | Infrastructure plus optional subscription | Infrastructure | Per-GB ingest plus indexed-event fees |
| Strengths | Feature depth, Kibana, security rules | AWS integration, no vendor risk | Zero ops, fastest setup |
| Watch out for | Needs cluster ownership | Trails Elastic on features | Bills that scale with log volume |
Most teams we work with land on a self-managed ELK stack once they pass roughly 50 GB per day—the point where ownership cost drops below SaaS pricing. For metrics, pair it with our Prometheus & Grafana implementation so each signal lives in a store built for it.
How Do You Size an ELK Cluster Without Overspending?
Start from arithmetic, not instinct. Take raw daily ingest, add about 10% for JSON and index overhead, then double it for one replica. 100 GB of raw logs a day becomes roughly 220 GB of cluster storage daily—6.6 TB for 30-day retention before you have built a single dashboard. That math is why unsized clusters blow budgets by quarter two.
Three levers control the bill:
- Data tiers. Keep 7–14 days on fast NVMe hot nodes, roll older indices to warm nodes on cheap disks, and push the long tail to frozen-tier searchable snapshots in S3, where storage can cost 90% less than hot.
- Index lifecycle management. Automate rollover at 25–50 GB per shard, drop replicas on warm indices, and force-merge before data leaves the hot tier.
- Ingest hygiene. Drop debug noise at the shipper, sample repetitive access logs, and strip fields nobody queries. It is common to cut ingest by a third this way with no loss of signal.
On the nodes themselves: keep JVM heap at or below 31 GB so compressed object pointers stay enabled, hold shard counts near 20 per GB of heap, and add three dedicated master nodes once you grow past a handful of data nodes. Sizing is a spreadsheet exercise we do with you before any hardware is provisioned—so the first invoice matches the estimate.
What Log Retention Strategy Satisfies Auditors?
Auditors care about three things: how long logs are kept, whether anyone could have tampered with them, and how fast you can produce a specific record. PCI DSS Requirement 10 sets the clearest bar—12 months of audit trail with the most recent 3 months immediately searchable. SOC 2 fixes no number, but a 12-month window satisfies most auditors, and HIPAA-adjacent environments often standardize on six years for access records.
Here is how those requirements map onto an ELK deployment:
- Hot and warm tiers hold 30–90 days fully searchable, so the “produce it now” test passes in seconds, not days.
- Older indices move to snapshots in versioned, lifecycle-managed object storage—cheap enough that a year of retention stops being a budget argument.
- Tamper resistance comes from separation: delete privileges stripped from everyday roles, snapshot repository credentials held apart from cluster admin, and audit logging enabled on the cluster itself.
- Quarterly restore tests, because a backup you have never restored is a hope, not a control.
We document the policy in plain language your auditor can file. If SOC 2 is on your roadmap, our SOC 2 compliance automation service wires this log evidence directly into your audit workflow.
Can ELK Work as a Security Analytics Platform?
Yes—for many mid-size engineering teams it replaces a dedicated SIEM entirely. Elastic Security ships hundreds of prebuilt detection rules in the free tier, and because detections run against the same cluster that holds your operational logs, you skip the cost and lag of forwarding data to a second platform.
A working security analytics build looks like this: Elastic Agent on hosts collecting auth events, process starts, and file integrity data; cloud audit trails such as CloudTrail and Kubernetes API audit logs flowing through the same pipelines; and detection rules correlating across all of it. Concrete detections we enable in the first week include brute-force patterns—say, twenty failed SSH attempts in five minutes followed by a success—impossible-travel logins, privilege escalation inside Kubernetes, and security-group changes outside a change window. Alerts route to Slack or PagerDuty with the matching events attached, so responders start with evidence instead of a search box.
Two details separate a real deployment from a checkbox one. First, access control: security indices carry their own roles with field-level restrictions, so log access does not equal incident-data access. Second, rule tuning: we baseline two weeks of your traffic before enabling noisy rules, because a channel full of false positives trains your team to ignore the one alert that matters. Our CTO holds the CKS security specialization, and it shows in how the Kubernetes detections are built.
What Are the Most Common ELK Mistakes You Fix?
Most rescue engagements start with the same seven problems, and none of them are exotic:
- Oversharding. Thousands of tiny daily shards eating heap; the fix is rollover by size, not by calendar.
- Mapping explosions. Dynamic mapping on unbounded fields until the cluster refuses writes.
- Heaps above 31 GB, which silently disable compressed pointers and waste the extra memory.
- No dedicated masters, so one data node’s GC pause triggers a full cluster election mid-incident.
- Grok bottlenecks. Regex-heavy Logstash pipelines pinned at 100% CPU that dissect or ingest pipelines handle at a fraction of the cost.
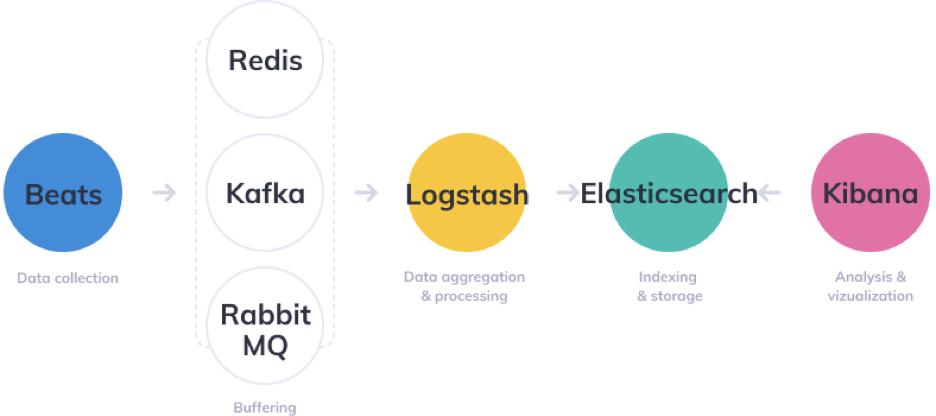
- No buffer. Without Kafka or a persistent queue, every traffic burst drops the exact logs you need afterward.
- Exposed clusters. Port 9200 open to the internet without TLS or authentication—still the most common finding in our first-day review.
A typical remediation runs two to three weeks: stabilize the cluster, rebuild index templates and lifecycle policies as code, then load-test before we leave. It is the same discipline behind the observability stack that powers 99.995% uptime for an e-commerce platform. If your cluster shows any of these symptoms, tell us what you are seeing and we will scope the fix.