Metrics vs. Logs vs. Traces: What Each Signal Actually Tells You
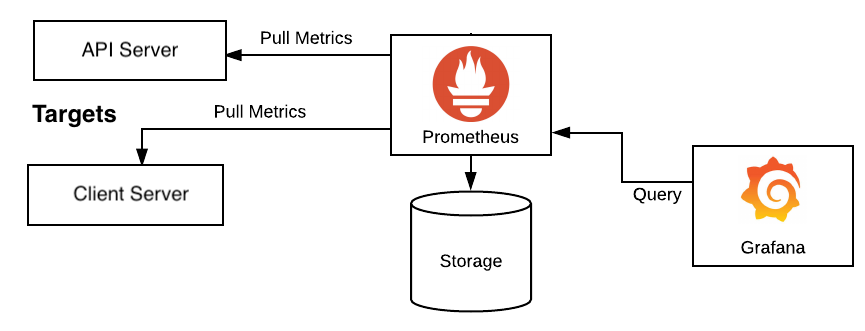
Observability gets sold as one product, but you are really managing three different signals with three different cost curves. Metrics are numeric samples over time — request rate, error percentage, queue depth, p95 latency. They compress well, query in milliseconds, and cost roughly the same whether you serve ten requests or ten million, which is why Prometheus treats them as the backbone of alerting. Logs are discrete event records carrying full context: the stack trace, the order ID, the exact query that timed out. Traces follow a single request as it crosses services and show precisely where the latency accumulated.
| Signal | Best at answering | Cost behavior at scale | Typical backend |
|---|
| Metrics | "Is something wrong right now?" | Flat — priced per series, not per event | Prometheus |
| Logs | "What exactly happened, and to whom?" | Grows linearly with traffic | ELK, Loki |
| Traces | "Where in the chain did it slow down?" | Moderate — normally sampled | Tempo, Jaeger |
The operating rule we implement for clients: alert on metrics, investigate with logs, confirm with traces. Prometheus fires the page because an SLI breached; Grafana links that panel straight to the matching log stream and trace view, so an on-call engineer moves from symptom to root cause in two clicks instead of twenty browser tabs. Metrics come first because they are the cheapest signal to retain for a year and the only one fast enough to drive alerting. If the logging half of your stack needs the same treatment, our ELK Stack implementation is built to pair with this service.
How Do You Design SLOs and SLIs That Actually Matter?
Most monitoring projects measure what is easy instead of what users feel. An SLI (service level indicator) should be a user-facing ratio: successful checkout requests divided by all checkout requests, or the share of API calls answered under 300 ms. CPU utilization is not an SLI — no customer has ever experienced your CPU. An SLO (service level objective) is the target you commit that ratio to, for example 99.9% over a rolling 30 days.
Two habits keep SLOs from becoming wall art. First, derive targets from measured baselines: we run each SLI as a Prometheus recording rule for two to three weeks, see where the service genuinely sits, and set the objective just above it — an aspirational 99.99% on a service that lives at 99.7% only trains people to ignore red. Second, treat the distance between the target and 100% as an error budget your team may spend on releases and experiments. When the budget burns fast, deploys pause and reliability work jumps the queue; engineers accept the deal because it cuts both ways.
We codify each SLI as a recording rule, attach multi-window burn-rate alerts to the budget, and pin SLO status to the top of every service dashboard. That structure carried an e-commerce platform to 99.995% uptime through its peak season — the full breakdown is in our observability case study.
Why Does Your Team Ignore Alerts — and How Do You Fix It?
Alert fatigue is not a discipline problem; it is a design problem. When a pager fires forty times a week and thirty-eight of those need no action, humans do the rational thing and stop looking. The cure starts with a hard rule: page on symptoms, never on causes. A node at 85% disk is a ticket for tomorrow; an SLO error budget burning ten times faster than normal is a page right now. Every page must pass three tests:
- Urgent — it needs a human in minutes, not at standup.
- Actionable — a linked runbook says what to do first.
- User-impacting — it maps to an SLI a customer can feel.
Mechanically, we implement multi-window, multi-burn-rate alerting on error budgets so slow leaks and sudden fires both surface without duplicate noise, then use Alertmanager grouping, inhibition, and routing so one upstream failure produces one notification instead of sixty. Cause-level signals still exist — they land in a dashboard or a ticket queue, not a phone. Finally, we make noise measurable: pages per on-call week become a tracked metric, reviewed and pruned monthly. This is the discipline behind the 5-minute mean time to resolution our clients report — responders trust the page, open the runbook, and act instead of triaging static.
When Should You Scale Prometheus Beyond a Single Node?
Later than most teams think. A well-sized single Prometheus server comfortably handles millions of active series; the real ceiling is memory, which grows with series cardinality rather than traffic. So the first scaling move is not more nodes — it is cardinality hygiene: drop labels like user IDs and request IDs that mint a new series per value, and enforce relabeling rules at scrape time so one bad deploy cannot explode your series count. When you genuinely outgrow one node, scale in this order:
- Run two identical replicas for high availability — cheap insurance, no new architecture.
- Add remote_write to object-storage-backed retention when local disk stops being enough.
- Adopt Thanos or Mimir when you need one query view across clusters, deduplication, and years of history.
- Use federation only for hierarchical roll-ups — it is a summarization tool, not a scaling fix.
On Kubernetes, the Prometheus Operator makes the per-cluster pattern straightforward: each cluster monitors itself, and a global layer queries across them, so one cluster's outage never blinds the rest. This design pairs closely with how the clusters themselves are run — see our Kubernetes cluster management service for the other half of that picture. The outcome to aim for: query latency stays flat while retention stretches to a year or more, and no single node failure costs you visibility.
What Makes a Dashboard Executives Actually Read?
Engineering dashboards fail upward. The 40-panel wall of CPU graphs that helps an SRE at 3 a.m. is exactly what makes a VP close the tab, because it answers questions leadership is not asking. An executive view earns weekly attention by answering three: are we keeping the promises we made to customers (SLO attainment, month to date), is reliability trending better or worse (30- and 90-day lines), and what did it cost us (incident count, error budget consumed, hours of degraded service).
The Grafana mechanics are deliberately boring: five to seven panels, business vocabulary in every title — "checkout success rate," not "http_5xx_ratio" — red/amber/green thresholds against agreed targets, and deploy and incident annotations so cause and effect line up visually. We keep audiences in separate folders: on-call dashboards stay dense and fast, service-owner views track SLOs per team, and the leadership view rotates on the office TV and lands in the monthly report as a snapshot link. One number appears on every tier — SLO status — so when an executive asks about an incident, both sides are reading the same definition of "down."
If your leadership asks the same three questions every month and your current tooling cannot answer them, that gap is usually a build measured in weeks, not a re-platform. Tell us which numbers your board asks for and we will scope a Prometheus and Grafana implementation that answers them.