FinOps Quick Wins: What Can You Cut in the First 30 Days?
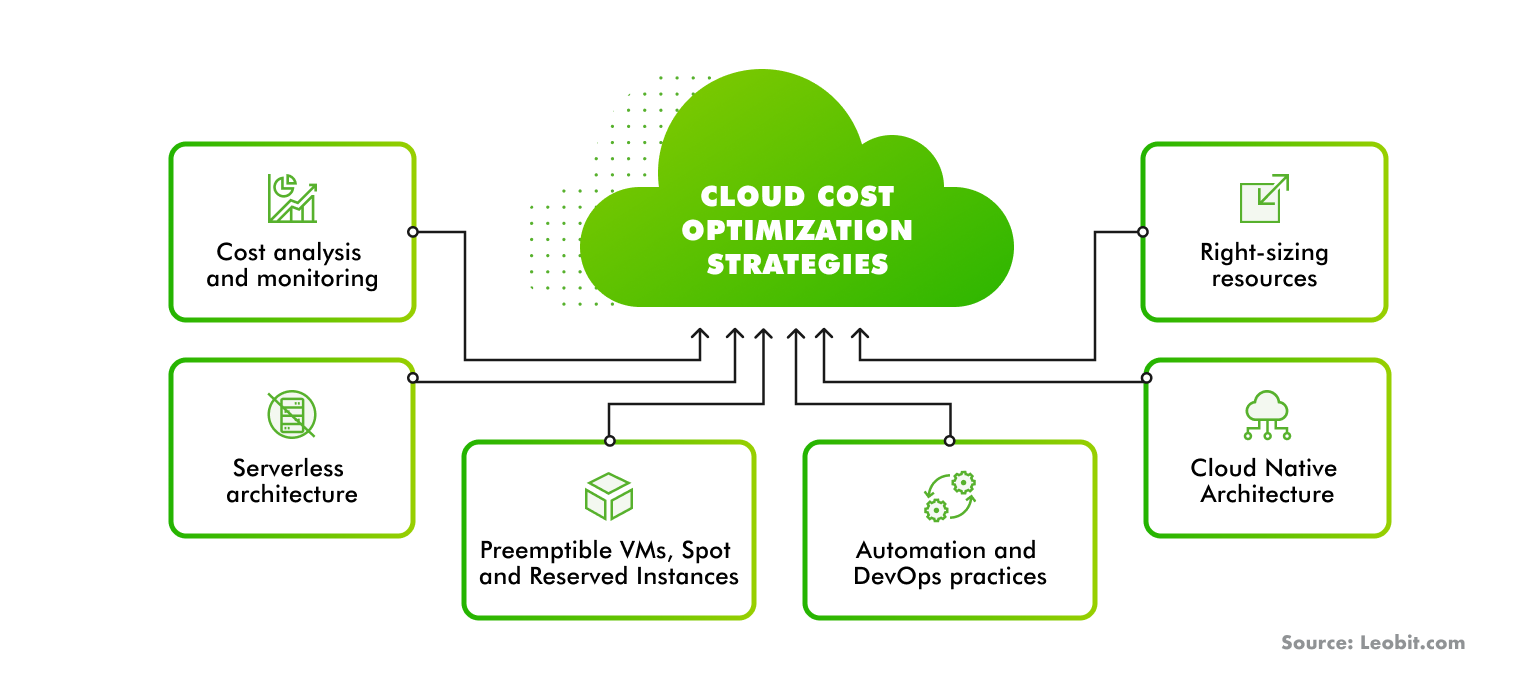
Most cloud bills carry 10-20% pure waste that can be removed without touching architecture, and that is where a cloud cost optimization engagement should start — visible wins that fund the deeper work. A realistic first month looks like this:
- Week 1 — establish the baseline. Turn on cost allocation tags, activate the Cost and Usage Report (or your provider's billing export), and measure how much spend has no owner. You cannot cut what you cannot attribute, and in an untagged account it is common to find a third of the bill unclaimed by any team.
- Week 2 — remove the dead weight. Unattached EBS volumes, snapshots older than your retention policy, idle load balancers, unassociated Elastic IPs, and stopped instances still paying for premium storage. These are safe deletions; nothing running depends on them.
- Week 3 — schedule non-production. Dev, test, and staging environments that run 24/7 but get used 45 hours a week burn roughly 70% of their runtime for nobody. An instance scheduler that stops them nights and weekends claws that back immediately.
- Week 4 — fix storage defaults. Migrate gp2 volumes to gp3 (about 20% cheaper for equivalent performance), add S3 lifecycle rules, and set budget alerts so the waste does not quietly creep back.
None of this requires downtime, refactoring, or a steering committee. It requires billing data access and a short approval loop with your engineers.
Rightsizing vs. Reserved Instances vs. Savings Plans: Which Comes First?
Sequence matters more than tooling here. Rightsize first, then commit — a three-year Reserved Instance purchased against an oversized server locks the waste in at a discount. Once instance sizes match actual workload behavior (judged on 30 days of CPU, memory, and network data, not peak-day guesses), commitment instruments convert the remaining steady-state usage into savings:
| Lever | Typical discount | Commitment | Flexibility | Best for |
|---|
| Rightsizing | 20-40% on affected resources | None | Full — adjust anytime | Over-provisioned compute and databases |
| Standard Reserved Instances | Up to 72% vs. on-demand | 1 or 3 years | Low — tied to instance family and region | Stable workloads you will not re-architect |
| Convertible RIs | Up to 66% | 1 or 3 years | Medium — exchangeable across families | Steady spend with some platform uncertainty |
| Compute Savings Plans | Up to 66% | 1 or 3 years | High — spans family, size, region, Fargate, Lambda | Teams whose workloads keep evolving |
| Spot capacity | Up to 90% | None | Interruptible on short notice | Batch jobs, CI runners, stateless workers |
A sound commitment strategy covers 70-80% of steady-state usage and leaves the volatile remainder on demand — full coverage feels efficient right up until you decommission a workload you are still paying for. Codifying the rightsized instance types in Terraform, the way our Infrastructure as Code solutions work, keeps the next deployment from silently reverting to the old sizes.
How Do You Allocate Kubernetes Costs by Team and Namespace?
A shared cluster arrives on the invoice as one undifferentiated block of node spend, which is why Kubernetes is where cost accountability usually breaks down. The bill is driven not by what pods use but by what they request: requests reserve node capacity whether it is consumed or not, so a deployment that asks for 2 CPU cores and uses 200 millicores forces the autoscaler to keep buying the gap. Closing that gap is typically the single largest Kubernetes saving available.
The working sequence:
- Label every workload with team, product, and environment, and enforce the labels with an admission policy so new deployments cannot skip them.
- Deploy OpenCost or Kubecost to map node, storage, and network spend onto namespaces and labels — per-team cost, idle cost, and the request-versus-usage gap in one view.
- Publish showback reports first; move to chargeback only once teams trust the numbers.
- Tune requests from real usage percentiles, then let a consolidation-aware autoscaler such as Karpenter pack nodes tighter and run stateless workloads on spot node pools.
Allocation changes behavior as much as it changes the bill — teams that see their own number cut it without being told. If day-2 cluster operations is the bottleneck, our Kubernetes cluster management service runs this allocation loop as part of the standard practice.
Which Cloud Cost Visibility Tools Are Worth Paying For?
Tool selection is where cost programs die of enthusiasm. The rule of thumb: exhaust the free native tier before paying a percentage of your bill to look at your bill.
- Native tools (free): AWS Cost Explorer plus the Cost and Usage Report, Azure Cost Management, and GCP billing export to BigQuery. Deep, accurate, single-cloud. The CUR queried through Athena answers most allocation questions a mid-size engineering org ever asks.
- Open source: OpenCost for Kubernetes allocation, and Infracost to print the cost delta of every Terraform pull request before it merges — cost review shifts left into code review, where it is cheapest to say no.
- Commercial FinOps platforms: CloudHealth, Cloudability, nOps, Vantage and their peers add multi-cloud normalization, chargeback workflows, anomaly detection, and automated commitment management. Pricing typically runs 1-3% of managed spend or a tiered subscription.
Pay for a platform when you run two or more clouds, when finance needs chargeback that survives an audit, or when your commitment portfolio is large enough that automated management beats a quarterly spreadsheet. Skip it for a single AWS account under $50k a month, where native tooling plus disciplined tagging covers 90% of the need. The decision is also reversible: start free, keep your tags and labels clean, and a later platform migration inherits usable data instead of a re-tagging project. Our recommendation follows your bill, not a preferred vendor.
How Much Can You Actually Save? Typical Percentages by Workload
Realistic ranges, by what each class of workload usually yields once the levers above are applied:
- Non-production environments: 40-65%. Scheduling plus rightsizing — reliably the biggest single win, because nobody ever sized dev for efficiency.
- Steady-state production compute: 25-40%. Rightsizing first, then commitment coverage on what remains.
- Kubernetes clusters: 25-45%. Request tuning, tighter bin packing, and spot node pools for stateless work.
- Storage: 20-50%. gp3 migration, lifecycle policies, intelligent tiering, and snapshot hygiene.
- Data transfer: 10-30%. VPC endpoints, NAT gateway consolidation, and a CDN in front of egress-heavy services — the most architecture-dependent category.
Blended, a first cloud cost optimization pass on an unoptimized account typically lands between 25% and 35% of total spend within a quarter. Mature accounts yield less: if you already run schedulers and Savings Plans, expect single digits to low teens, with the value shifting to stopping rate creep. What the percentages hide is durability — one-off cleanups decay within months unless ownership, alerts, and guardrails keep them in place. That is why every cut we make ships with a named owner, a budget alert, and a review cadence attached.
If you want these ranges translated into a number for your actual bill, send us a note — a read-only look at your billing data is enough to produce a concrete estimate.